Monitoring The Future: Trends in Prevalaence of Various Drugs
This survey tracks trends in Prevalence of Various Drugs for 8th Graders, 10th Graders and 12th Graders (in percent) from 2015 – 2018. The data identifies “Lifetime,” “Past Year,” and “Past Month,” as the time periods addressed. The study identifies 8th Graders as the leading users of inhalants for all four years, with 10th Graders being second, and 12th Graders last. Although the percent of teens using inhalants in each grade level has declined over the four year period studied, both 8th Grade and 10th Grade use decreased less than one percent (0.7) in the “Lifetime” response area, while 12th Graders inhalant use decreased 1.3 percent. Much lower percentages were identified for the “Last Month” category with percent listings at 4.6, 2.4, and 1.6 for Grades 8, 10 and 12 respectively (NIH, 2018).
Although this survey is relevant in relation to inhalant use and attitudes among the participating teens, the subject population was only 44,482 students attending 392 schools. The U.S. 2017 Census Report of Youth Enrolled in Schools in the U.S. at that time identified 70 million students, in 13,588 school districts and in 132,183 schools. The number of school districts alone far exceeds the number of schools involved in this study. Therefore, this survey includes an extremely small portion of the number of teens in the country for all included years. A much more involved study needs to be completed before concluding that teen inhalant use has decreased in this country (U.S. Census Bureau, Current Population Survey, School Enrollment, October 2017).

The National Survey on Drug Use and Health
There are two documents available; SAMSHAs March 2014 report discussing results from the 2002-2012 survey data, and the NIH data information which documents survey responses from 2015-1017. The March 2014 report discusses data collected from students ages 12 to 17 years old during the period from 2002 to 2012. Both data sets address how often adolescents/teens used inhalants during different time periods of their life. The data is reported by age, race and geographic area in the U.S. The second report not only evaluates the drug use in teens in the U.S. from 2015-2017, it also includes students up to and over the age of 26 years. This discussion will only focus on the “Inhalants” drug section of this second set of data. The age groups identified from the 2015-2017 data are: “Ages 12 or Older;” “Ages 12-17,” “Ages 18-25” and “Ages 26 or Older.” The response categories are: “Lifetime,” “Past Year,” and “Past Month.” Again, numbers are reported in percent.
The SAMSHA March 2014 report states that in 2012, almost 650,000 adolescents aged 12 to 17 years old used inhalants in the past year. Although there has been a decline in the percent of students using inhalants since 2006, there are still many teens involved in this form of substance abuse. In 2011, 3.3 percent of the surveyed population stated they had used inhalants, while in 2012, only 2.6 percent of the surveyed population indicated they had. Decreases were noted in the demographic groups: males, whites, those living in the Northeast and West, and those living in metropolitan areas (SAMSHA, 2014).


Number of Days Inhalants Were Used in the Past Year (NSDHU report 2014).

Youth Risk Behavior Surveillance System (YRBSS)
The 2017 survey results for the Youth Risk Behavior Surveillance Survey is very complete if you want to review unsafe behaviors of youth in 2017. Although it does incorporate most states in the U.S., there are only 14,765 questionnaires and 144 schools involved in this data. Again, an extremely small population for this country. It evaluates everything from safe driving habits (texting and use of alcohol while driving) to drug use, sexual behaviors, bulling, eating habits, medical visits and much more.
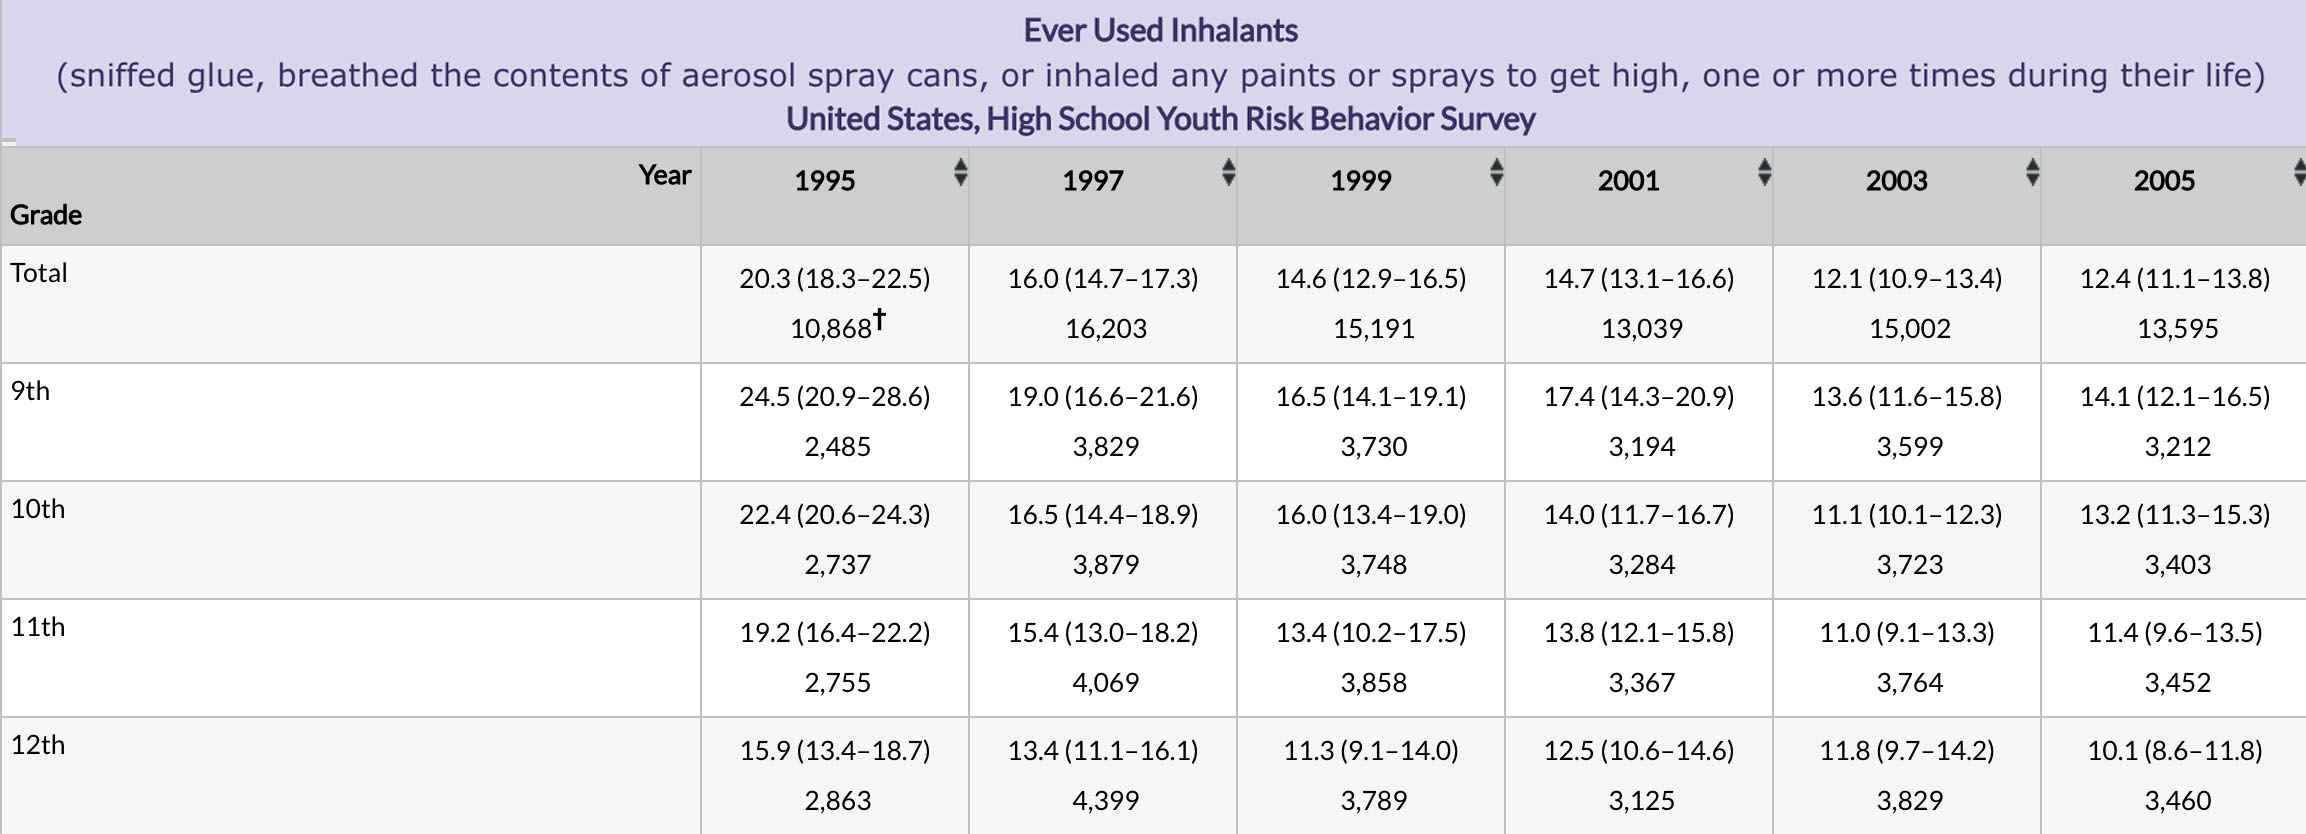
A better source of data from this same survey, specifically displays “inhalant” data in a format you can analyze. The “Youth Online: High School YRBS – U.S. 1995-2017,” lists inhalant use data for grades 9, 10, 11, and 12 for all years from 1995 though 2017. The data has been organized by “Total,” “Race,” “Grade,” and “Year.” Again, the population is relatively small and values are listed in percentages.
Findings for the Total population surveyed demonstrate that inhalant use has decreased from 20.3 (total), 24.5 (9th), 22.4 (10th), 19.2 (11th), and 15.9 (12th) percent in 1995, to 6.2 (total), 7.2 (9th), 5.7 (10th), 6.4 (11th), and 4.9 (12th) percent in 2017. This identifies a 14 percent drop in inhalant use in the Total population surveyed. Again, this is clearly a very small portion of the teens in the U.S. but is something positive to note.


